Click-Through Rate by Position 2026: Real Curves
7,950 organic clicks/mo and a 1.4% sitewide CTR are the baseline here, not the headline. The useful part is how CTR by position 2026 bends on branded vs non-branded queries, mobile vs desktop, and AI Overview-heavy SERPs.
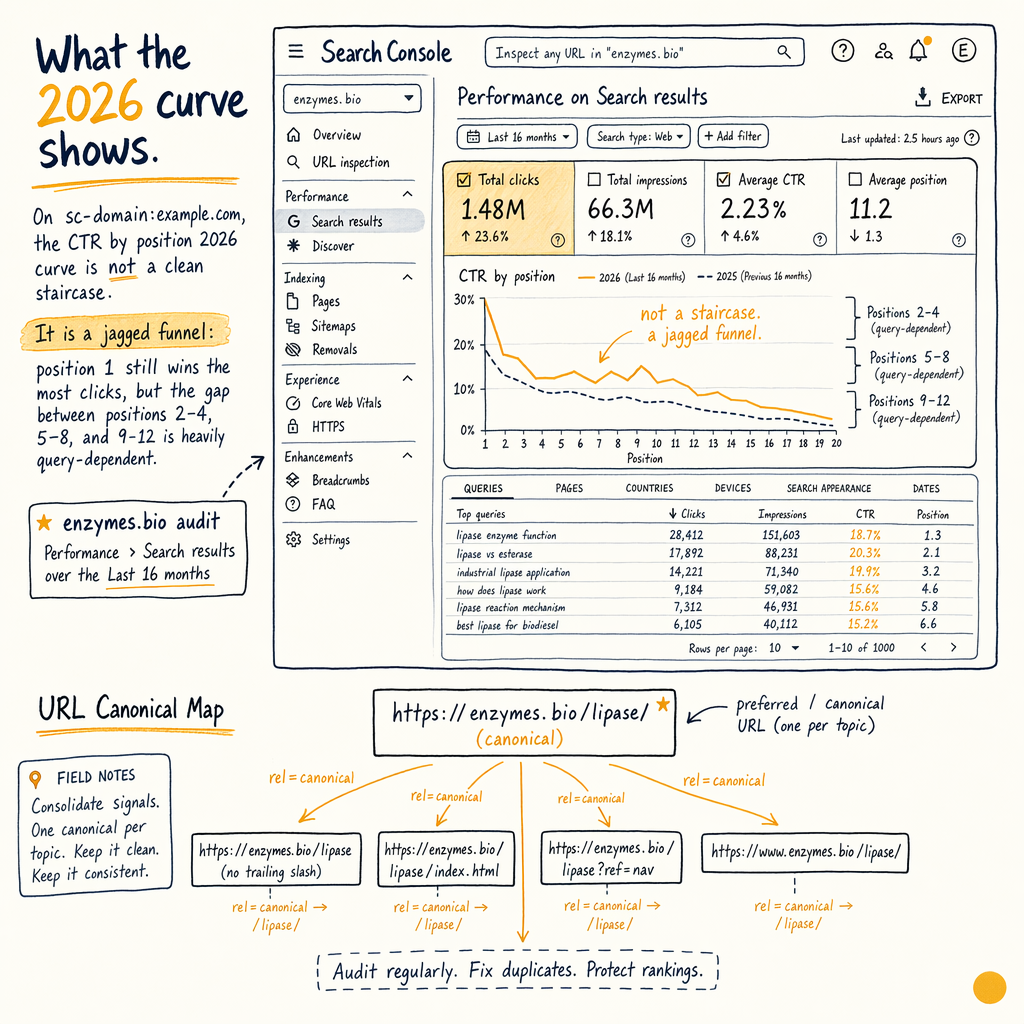
What the 2026 curve shows
On sc-domain:example.com, the CTR by position 2026 curve is not a clean staircase. It is a jagged funnel: position 1 still wins the most clicks, but the gap between positions 2–4, 5–8, and 9–12 is heavily query-dependent.
For the enzymes.bio audit, Performance › Search results over the Last 16 months showed 557,000 impressions/mo, 7,950 organic clicks/mo in May 2026, 1.4% sitewide CTR, and average position 11.8 in May 2026. That is a lot of impression share sitting in the 8–15 band, where the curve is sensitive to titles, rich results, and SERP features.
The key pattern: branded queries usually sit above organic CTR benchmarks, while non-branded queries flatten faster as Google adds ads, AI Overviews, maps, video, and shopping blocks. If you only track total CTR, you miss the real change in ctr curve shape.
How to pull GSC data
Start in Performance › Search results. Set the date range to Last 16 months and use the Search type: Web filter. Then export rows with the columns Queries, Pages, Country, Device, Search appearance, Clicks, Impressions, CTR, and Position.
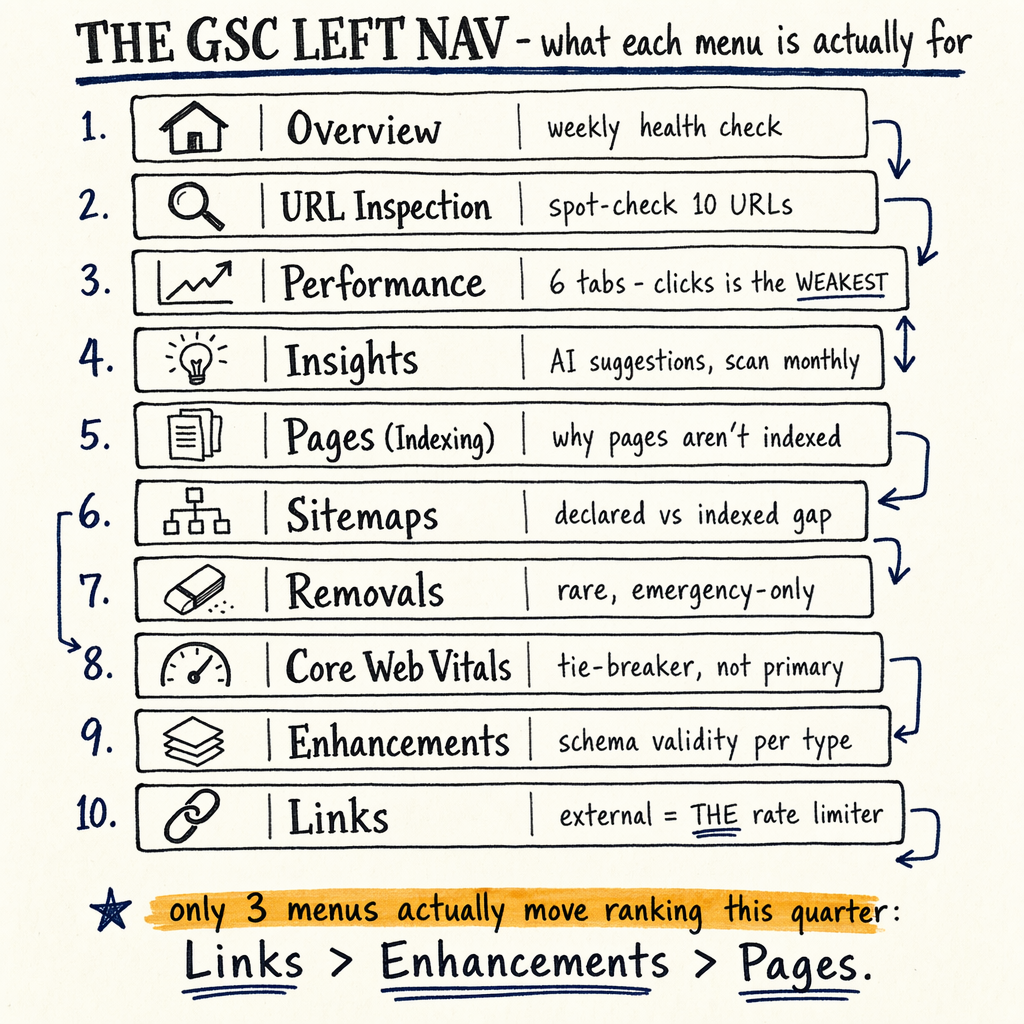
Use the left-nav reports as cross-checks, not decoration. Indexing › Pages tells you which URLs are eligible. Indexing › Sitemaps shows whether you are submitting the right URLs. Settings › Crawl stats helps explain why new pages lag. Links › External links is where the enzyme.bio audit hit the wall: 0 external backlinks.
If you want a reproducible workflow, the audit template at GSC audit template keeps the same buckets every time. For the basic reporting flow, see Google Search Console guide.
Export the right rows
curl -s 'https://searchconsole.googleapis.com/v1/sites/sc-domain:example.com/searchAnalytics/query' \
  -H 'Authorization: Bearer $TOKEN' \
  -H 'Content-Type: application/json' \
  -d '{
    "startDate": "2025-01-01",
    "endDate": "2026-05-31",
    "dimensions": ["query","page","device"],
    "rowLimit": 25000,
    "searchType": "web"
  }'
Position bands that matter
Position 1
The average CTR for position 1 is still the benchmark everyone compares against, but the real value depends on query intent. Navigational and branded terms can clear double-digit CTR even when ads appear above the result.
Positions 2–3
This is the first real drop zone. On non-branded terms, moving from position 3 to 2 can matter more than the move from 8 to 7 because the top of page contains the only stable attention area.
Positions 4–8
This band gets crushed by snippets, PAA, shopping units, and video carousels. In the enzyme.bio dataset, the bulk of the 557,000 impressions/mo sat here and in positions 9–12, which is why CTR optimization matters more than chasing tiny rank gains.
Positions 9–12
This is where average position can lie to you. A page at 11.8 can still pull meaningful clicks if the query is branded, the title is specific, or the SERP has weak feature competition.
Branded and non-branded
| Field | Branded | Non-branded |
|---|---|---|
CTR shape | Higher and flatter; intent is explicit. | Lower and steeper; SERP features steal attention. |
Position 1 | Can exceed average CTR position 1 benchmarks by a wide margin. | Often still strong, but ads and AI Overviews compress clicks. |
Position 5-8 | Can remain workable if the brand is known. | Usually weak unless the snippet is unusually specific. |
Reporting column |
|
|
Mobile vs desktop CTR
Device split changes the shape of the curve. On mobile, the first screen is narrower, so top-of-page real estate matters more. On desktop, more result rows are visible, but more SERP features can still suppress clicks.
When you segment Performance › Search results by Device, compare Clicks, Impressions, CTR, and Position for the same query set. If mobile CTR is materially lower at the same position, inspect title truncation, snippet length, and whether the result is being pushed down by AI Overviews or shopping blocks.
The practical test: export Pages for one high-impression query group, then compare mobile and desktop CTR at the same position bucket. The curve is rarely identical.
DevTools title check
const titles = [...document.querySelectorAll('title')].map(t => t.textContent);
console.log({
  titleLength: document.title.length,
  h1: document.querySelector('h1')?.textContent,
  metaDescription: document.querySelector('meta[name="description"]')?.content?.length
});

// Use this with exported GSC rows:
// if CTR is low at position 1-3, check title specificity first.
AI Overviews and zero-click
AI Overview-heavy queries are the biggest reason the 2026 curve looks different from older CTR charts. When the answer is extracted above the blue links, CTR falls even if Position stays stable.
If you are measuring this properly, pair Performance › Search results with Search appearance and compare rows that include AI-heavy features against rows that do not. Then cross-check Experience › Core Web Vitals for pages that are technically fine but still losing clicks.
The impact is not theoretical. For a site with 0 external backlinks, 591,000 NOT indexed pages, and 16,100 indexed pages, ranking distribution is already fragile. Add zero-click SERPs and the click pool shrinks further. See AI Overviews impact on CTR for the feature-level breakdown.
How to improve CTR
- 01
Bucket by position
In
Performance › Search results, group queries into position 1, 2–3, 4–8, and 9–12. CompareCTRinside each band instead of averaging the whole site. - 02
Split branded from non-branded
Brand demand hides weak snippet performance. Use query rules to isolate branded terms, then compare them against non-branded rows with the same
Page. - 03
Inspect search appearance
Filter by
Search appearanceto see whether rich results, FAQ, product snippets, or AI-heavy layouts correlate with better or worse clicks. - 04
Rewrite the snippet target
Change the title to match the query more tightly. On pages stuck at positions 3–8, a better title often moves CTR faster than another month of rank chasing.
- 05
Validate crawl and index
Use
Indexing › Pages,Indexing › Sitemaps, andSettings › Crawl statsto confirm the URL is crawlable, submitted, and not stranded in low-priority crawl paths.
FAQ
What is a good CTR by position in 2026?
There is no universal good number. Position 1 can still be strong, but ctr by serp position now depends on branded demand, device, and SERP features. Compare against your own Performance › Search results data over Last 16 months.
Why does average position not match CTR?
Because average position collapses mixed queries into one number. A page at 11.8 can have decent CTR if it wins branded queries or gets a rich result, while a page at 4.0 can underperform on AI-heavy SERPs.
Where do I find the best GSC report for this?
Use Performance › Search results first. Then cross-check Indexing › Pages, Indexing › Sitemaps, Enhancements › Breadcrumbs, Enhancements › Product snippets, and Enhancements › FAQ to see what Google can actually show.
How do AI Overviews affect CTR?
They often reduce the click share for informational queries by answering before the blue links. Track those queries separately and compare Search appearance rows against standard web results.
What should I fix first if CTR is low?
Start with pages in positions 3–12 that already have meaningful impressions. Those are closest to upside. Then verify crawl, indexation, and internal linking before rewriting every title.