Fix INP with third-party script control
**INP is usually a main-thread problem, not a content problem.** If tags, widgets, and client-side code are blocking input handling, Google sees it in field data long before Lighthouse makes it obvious.
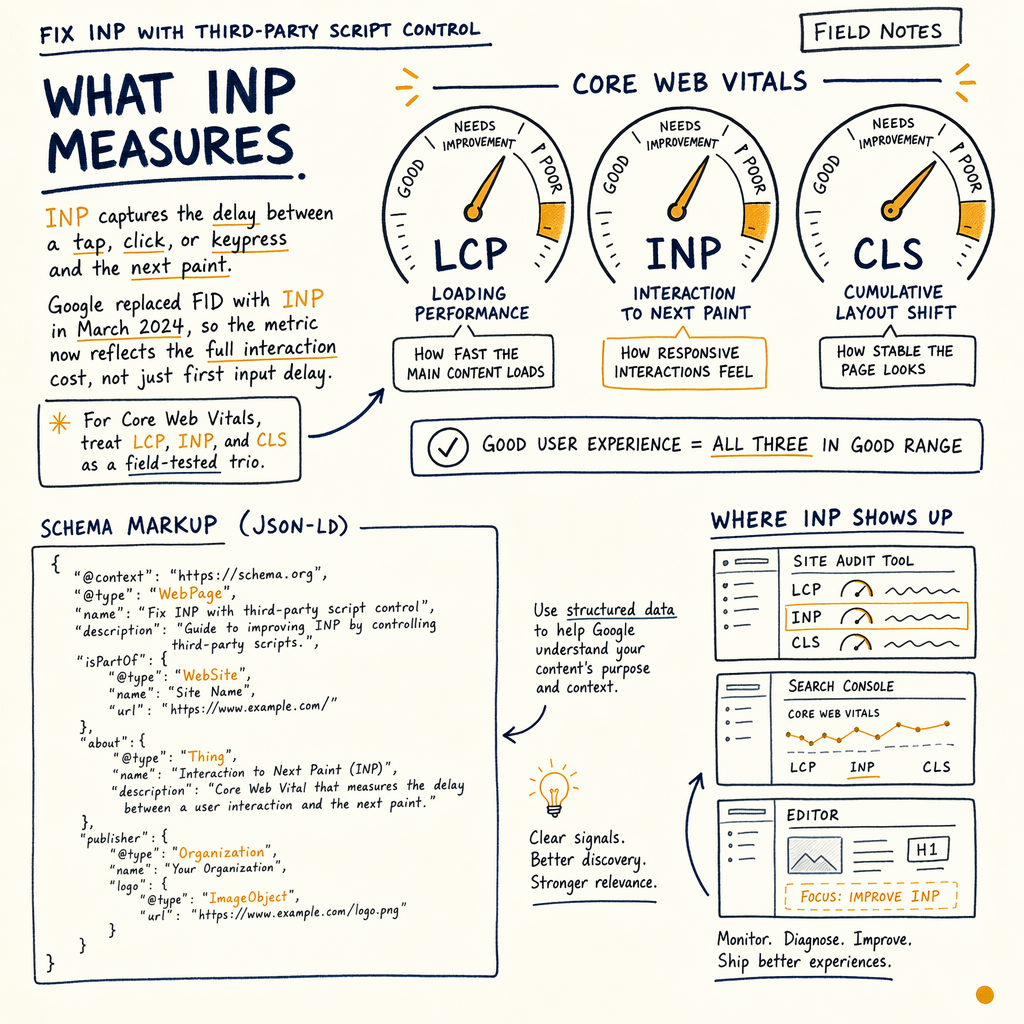
What INP measures
The page is about fix INP in the real sense: reducing the delay between a tap, click, or keypress and the next paint. Google replaced FID with INP in March 2024, so the metric now reflects the full interaction cost, not just first input delay.
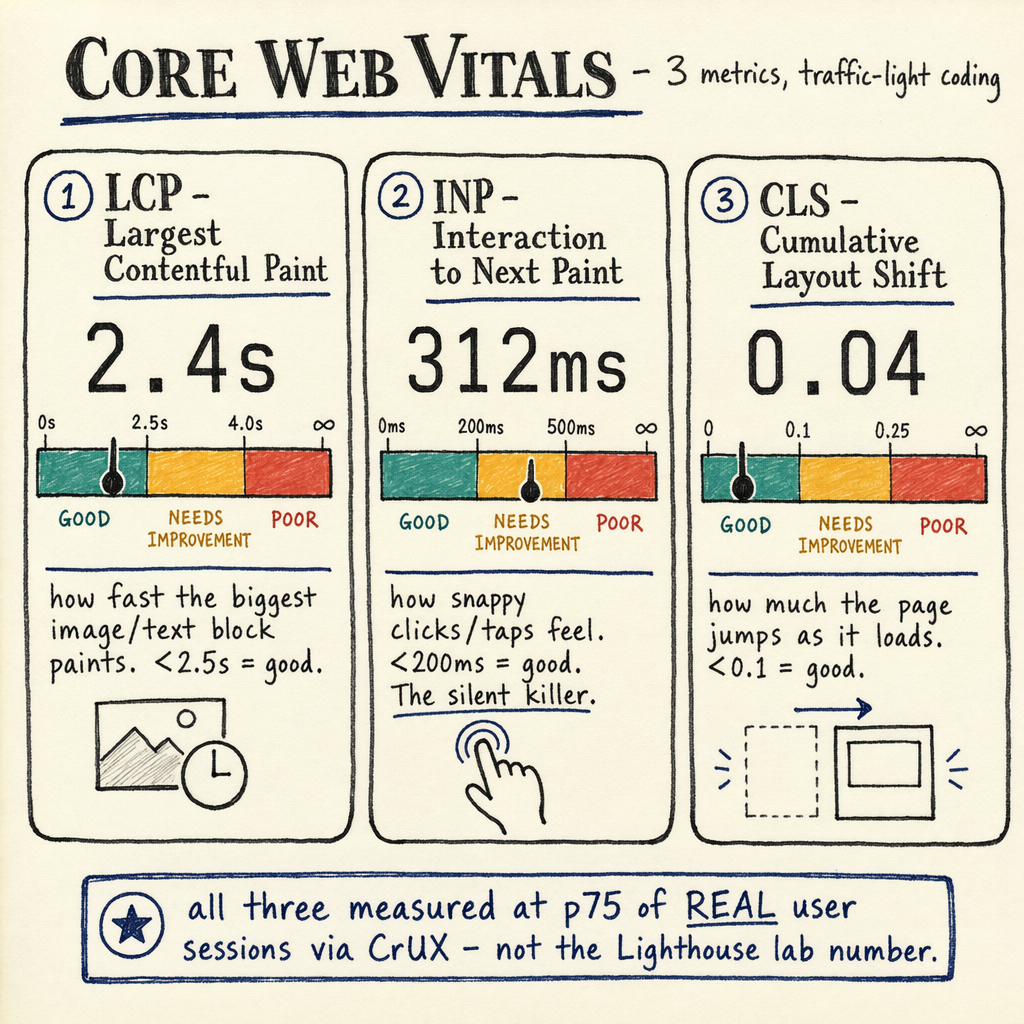
For Core Web Vitals, treat LCP, INP, and CLS as a field-data set. Use CrUX p75 for the decision. Lighthouse is still useful for debugging, but the pass/fail line should follow real-user data, not a lab-only screenshot.
On enzymes.bio, the site sits at 7,950 organic clicks/mo in May 2026, up from 2,770 in May 2025, with 557,000 impressions/mo, 1.4% CTR, and 11.8 average position in May 2026. That growth happened with 0 external backlinks, so the rate-limiter is not authority. It is performance, indexing, and script overhead.
Find script offenders
Third-party tags
Start with analytics, ads, heatmaps, chat, A/B testing, and consent tools. These often inject synchronous work, network contention, and repeated layout reads.
Long tasks over 50 ms
If the main thread is busy for 50 ms or longer, input waits. Track longtask clusters, not just one slow file.
Hydration and event handlers
Client-heavy frameworks can ship too much JS before the page is interactive. That raises the chance of input delay even when the HTML looks fine.
Translate and personalization
Enzymes.bio runs 35 languages via TranslatePress, which adds useful complexity. Language switching and personalization should not block primary interactions.
Reduce long tasks
- 01
Measure the actual interaction
Use the interaction timing lane in DevTools and compare it with GSC
Performance › Search results. If clicks are high but INP is poor, the issue is usually code, not demand. - 02
Split and defer non-critical JS
Move non-essential bundles off the initial path. Defer widgets, lazy-load below-the-fold modules, and stop shipping scripts that only matter after engagement.
- 03
Yield back to the main thread
Break work into smaller chunks with
scheduler.yield(),setTimeout(0), or request callbacks. The goal is to let input handlers run before the next paint is blocked. - 04
Remove repeated DOM work
Cache selectors, avoid forced reflow, and batch style writes. A few repeated layout reads inside a click handler can turn into the worst interaction on the page.
Control tag manager impact
| Field | Better pattern | Common anti-pattern |
|---|---|---|
Execution | Load after consent or after first input | Fire everything on page load |
Scope | One tag per need | One container that triggers ten vendors |
Timing | Idle time or user-initiated | Main-thread contention during render |
Debugging | One tag, one network request, one event | Nested triggers and opaque callbacks |
Use better loading patterns
<script>
  // Yield before heavier interaction code runs.
  const run = async () => {
    await scheduler.yield();
    import('/assets/cart-widget.js');
  };

  document.addEventListener('click', (e) => {
    if (e.target.matches('[data-open-cart]')) run();
  }, { passive: true });
</script>

<script defer src="/assets/analytics.js"></script>
<script async src="https://example-cdn.com/vendor.js"></script>

<div id="chat-root" hidden></div>
<script>
  requestIdleCallback(() => {
    const el = document.getElementById('chat-root');
    el.hidden = false;
  }, { timeout: 2000 });
</script>
Audit in GSC
Use Experience › Core Web Vitals to find the URLs that are failing in field data, then compare those URLs with Indexing › Pages. If a page is not indexed, slow interaction code may be one reason it is not earning enough quality signals to matter.
For crawl pressure, check Settings › Crawl stats. On large sites, JavaScript bloat can push response and processing time up together. Then verify whether the affected URLs also have messy signals in Enhancements › Breadcrumbs, Enhancements › Product snippets, or Enhancements › FAQ.
The same audit pattern applies to Indexing › Sitemaps: if your sitemap includes low-value parameter URLs, Google wastes crawl budget on pages that do not need to be fast, indexed, or interacted with. Keep the sitemap clean, and keep the main thread cleaner.
Inspect interaction timing
// DevTools console helper for a quick INP-style look at handlers.
performance.getEntriesByType('event').forEach((entry) => {
  if (entry.duration > 50) {
    console.log({
      name: entry.name,
      duration: Math.round(entry.duration),
      processingStart: Math.round(entry.processingStart),
      startTime: Math.round(entry.startTime)
    });
  }
});

new PerformanceObserver((list) => {
  for (const entry of list.getEntries()) {
    if (entry.duration > 50) console.log('Long task:', entry.duration);
  }
}).observe({ type: 'longtask', buffered: true });
Fix patterns by platform
WordPress
Plugins are the usual INP tax. Review every plugin that injects JS, then compare the impact with the guidance in WordPress SEO.
Tag-heavy marketing stacks
If the site uses a container for multiple vendors, split the page types. Put high-value events first and push secondary tools behind user action.
App-like front ends
For React, Next.js, Astro, and similar setups, reduce hydration scope. Ship less JavaScript to the first viewport and avoid binding everything at once.
Commerce checkouts
Checkout scripts should win only when they affect revenue. The rest can wait. Enzymes.bio has 943 orders and $240,809 lifetime revenue, so the business case for faster interactions is not abstract.
Common INP questions
What is a good INP target?
Aim for p75 under 200 ms. Between 200 ms and 500 ms is needs improvement. Above 500 ms is poor, and the page is likely carrying too much JavaScript or too many blocking tasks.
Why does Lighthouse say the page is fine?
Because Lighthouse is a lab measure. It can miss real-device timing, third-party contention, and user-specific input patterns that show up in CrUX field data.
What usually causes bad INP?
The most common causes are heavy third-party scripts, large hydration payloads, expensive event handlers, and repeated layout work inside click or keypress callbacks.
Should I remove all third-party scripts?
No. Remove the ones that do not earn their keep. Keep only the scripts that are needed, delay the rest, and isolate high-cost vendors from first interaction.
How do I connect this to GSC?
Use Experience › Core Web Vitals for field status, Performance › Search results for demand, and Indexing › Pages to see whether affected URLs are even eligible to rank.
When to call for help
If the site has many vendors, a CMS plugin pile, or a client-side app shell, the fix can cross front-end, analytics, and delivery layers. That is where a structured audit pays off.
For a broader pass, pair this page with fix render-blocking resources and tag manager performance impact. If the problem is rooted in script loading, the repair is usually faster than the diagnosis.
Need a second set of eyes? Request an audit or See all services.